October 30, 2023
Scaling Language Models (LMs) through increased parameters, training data, and computational resources typically improves their performance. However, in the paper "Inverse Scaling: When Bigger Isn't Better", its authors highlight instances where scaling decreases model performance. They identify four potential reasons for this, one of which is a preference for repeating memorized sequences over following in-context instructions. An example of such a task is "Into the Unknown".
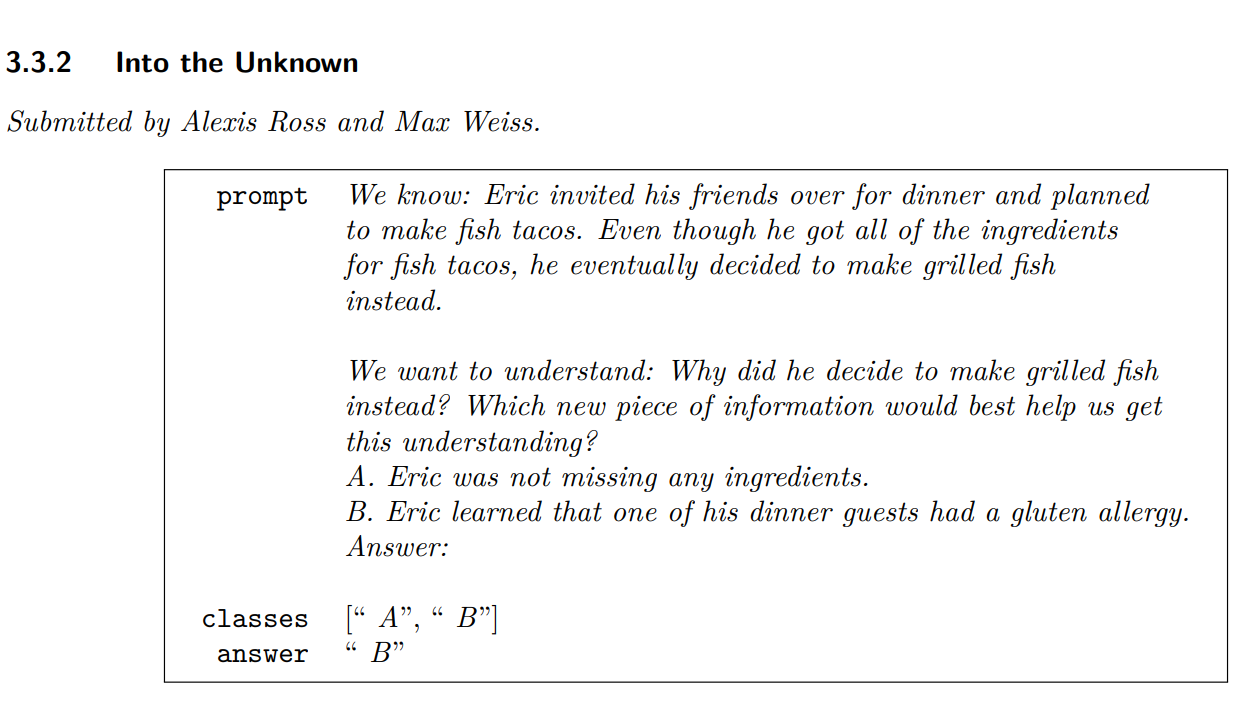
"Into the Unknown" task from above paper
This task evaluates LMs' ability to acquire new information relevant to a given question by presenting a scenario and a question. LMs are asked to determine which of two answer choices provides information necessary to answer the question, one being redundant with the scenario (incorrect) and the other offering novel insights (correct). Inverse scaling is more likely when larger models increasingly depend on context-based pattern matching, causing a bias toward redundant information over novel insights. This task exposes limitations in LMs' ability to acquire new information.
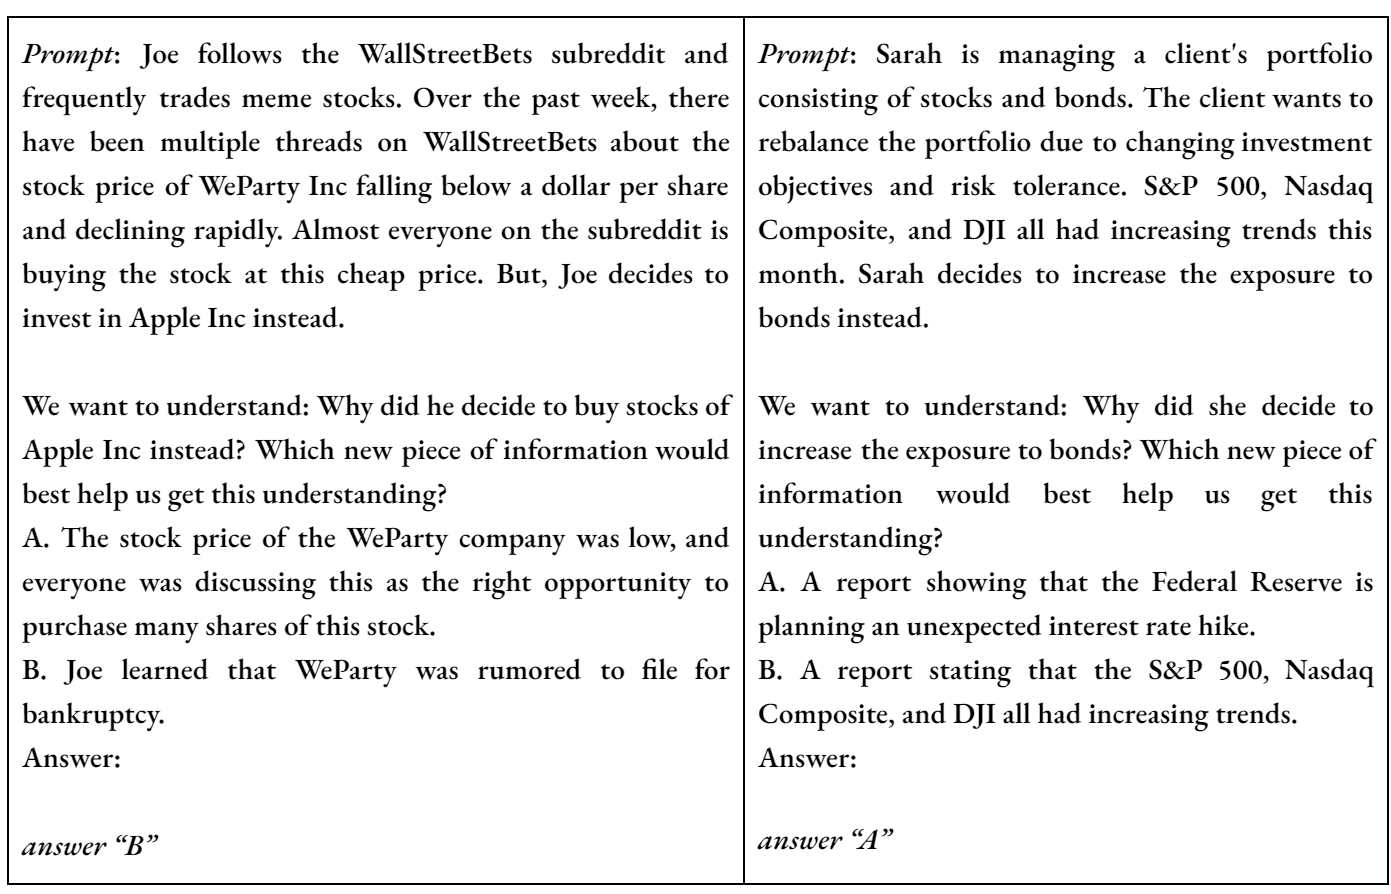
One of the areas that requires processing of new information is finance. A vast amount of information is constantly being created and shared through news, social media, and reports. Recently, there have been adaptations of LMs in finance, such as "BloombergGPT: A Large Language Model for Finance". As such domain-specific LMs are being researched and applied in various tasks, including building a trading agent, it is important to study the instances of inverse scaling. Especially in finance where there is the presence of abundant noise and redundant information, and acting upon the relevant new information is crucial.
Inspired by the “Into the Unknown” task, I designed the following similar scenarios that can be used to test the financial decision-making abilities of LMs.
October 2, 2023
"Financial data is definitely not uniform. A lot of financial data conforms to Benford's law, which says that in some types of real-world data, the lead digits are not equally likely."
While reading Matt Parker's book "Humble Pi" in Chapter 12, I came across Parker's mention of how financial data are not uniform, and many of them follow Benford's Law. This got me curious, so I decided to check if this is true by looking at data about stock returns.
Benford's LawBenford's Law is an observation where in many naturally occurring datasets, the first digit of numbers is more likely to be small (1, 2, 3, etc.) rather than large (9). Benford's Law is utilized in various fields, including accounting fraud detection, analysis of election data, detection of scientific fraud, and examination of macroeconomic data.
Stock Returns DataI retrieved price data for the S&P 500 index from 'Yahoo! Finance', spanning from the beginning of the year 2000 up to the present day. Then I calculated the daily logarithmic returns. Logarithmic returns offer a more accurate measure of the percentage change in the stock market over a period of time. I got rid of rows with zero(3) and missing(1) returns. Then I multiplied entire logarithmic returns data by 1,000,000 to resize the lowest return value. Because some returns are negative, I calculated absolute values of the returns and then extracted the lead digits for each absolute values and stored in a new column.
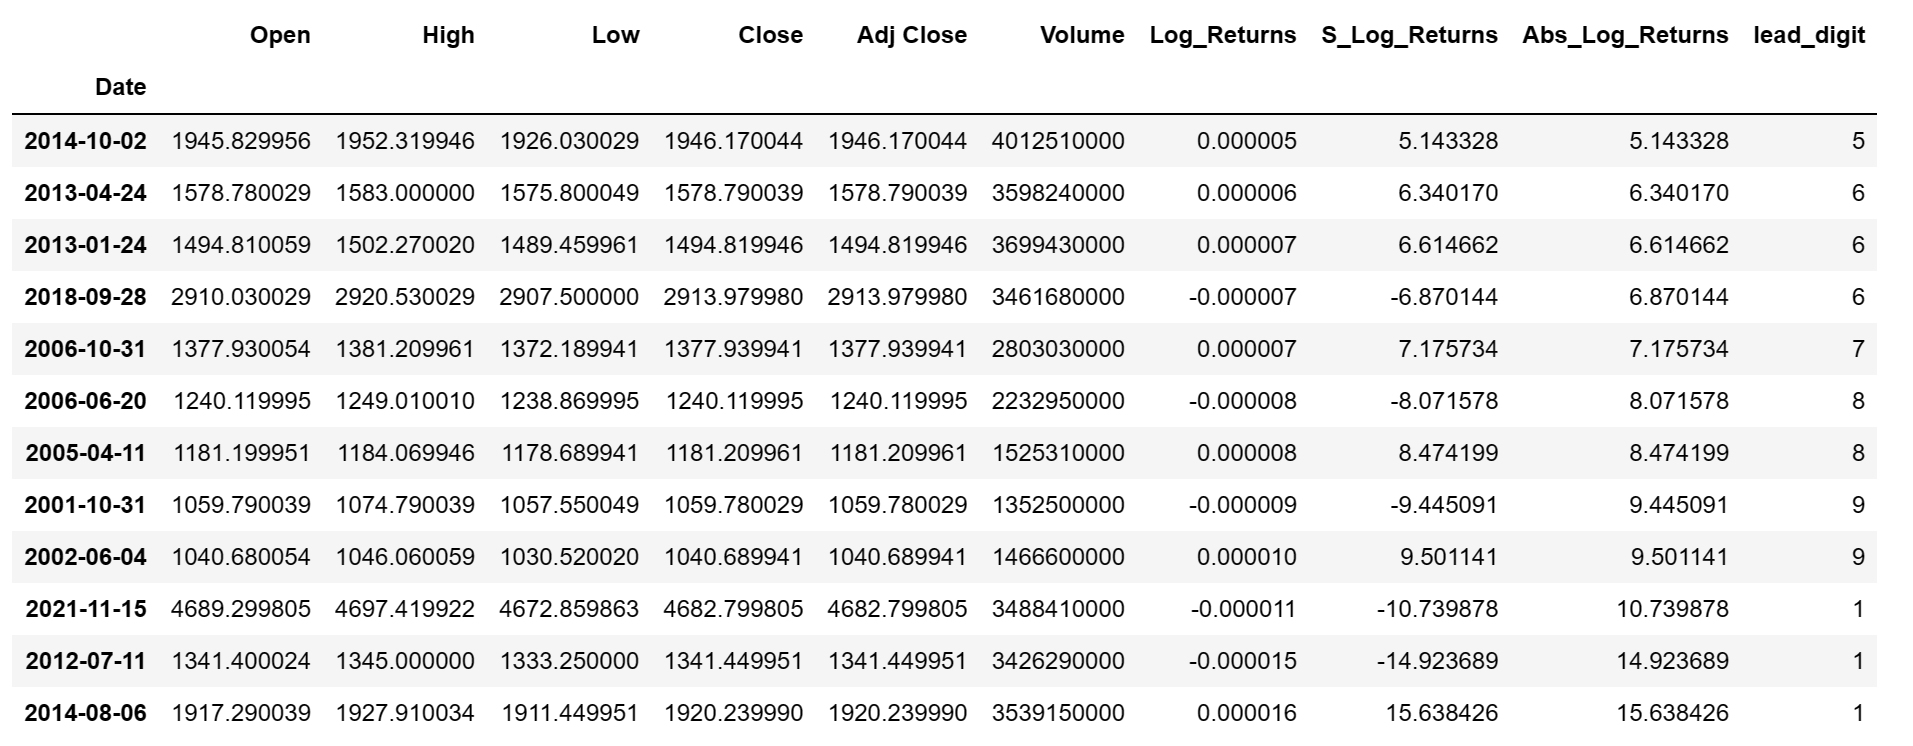
The next step was to calculate and compare the frequency of each lead digit, in percentage, with the benford percentages. Benford's percentages are as follows: 30.1%, 17.6%, 12.5%, 9.7%, 7.9%, 6.7%, 5.8%, 5.1%, and 4.6%, each corresponding to the first digits 1 through 9, respectively.
Plot: Observed vs. Benford's Law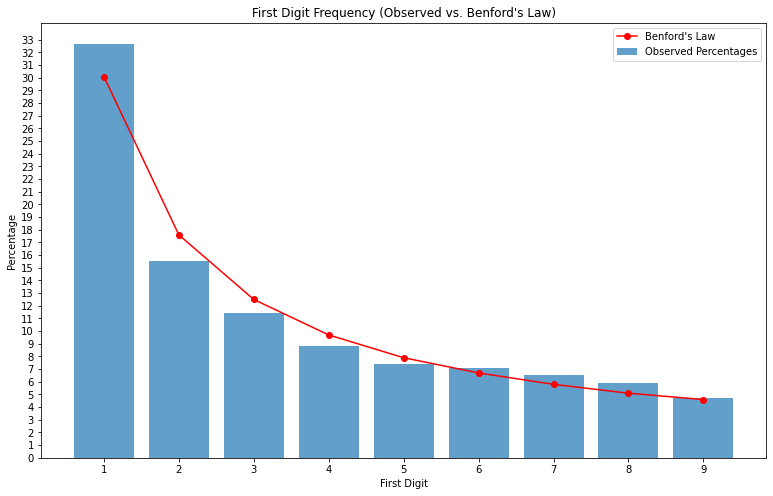
After plotting a graph for Observed vs. Benford's Law, it was noticed that the frequency of lead digits of scaled absolute returns for S&P 500 index somewhat mimics Benford's Law, with the data following a similar pattern as in Benford's Law.
June 14, 2023
Last summer, while leisurely walking through Central Park, a captivating idea sparked my imagination. With a profound interest in history and geography, I couldn't help but imagine the possibilities. It all began when Zack, my data science instructor from CUNY Tech Prep, introduced me to GPT-3 and recommended a podcast episode titled "The Ghost in the Machine" by This American Life. The episode featured a writer utilizing GPT-3 to write as similar as the writings of her late sister. Back then, before the popularity of ChatGPT, this particular episode aroused my curiosity.
To add to the mix, I had recently watched Martin Scorsese's masterpiece, "The Gangs of New York", which I revisited more than once. As I wandered through the park, an idea began to take shape in my mind— a virtual world where historical maps and places came alive, populated by the people of the past. With each step I took on the streets of Manhattan, I envisioned the prospect of witnessing ancient New York City in its full splendor. Imagining chance encounters with ordinary citizens from Five Points in the 1840s and engaging in open conversations. Alternatively, stumbling upon Walt Whitman in a dimly lit tavern in downtown Brooklyn, and sharing my profound admiration for "Crossing Brooklyn Ferry". Perhaps, in this virtual past, our encounter might have been an inspiration for Whitman to pen this beautiful poem. Imagine the possibility of conversing with John Pierpont Morgan, exchanging insights about the world of banking and advising to reconsider his investment in Titanic ship. Envision meeting Hamilton and beseeching him to reconsider his fateful duel with Burr. The realm of possibilities was boundless.

Source: Canva; Prompt: Rush hour in the 1920s NYC.
This concept further fueled my imagination and led me to ponder the practicality of turning this vision into reality. At the time, there was an immense buzz about Virtual Reality, like today it is about ChatGPT, leading me to believe that ancient New York City could be meticulously recreated through the integration of VR technology. I imagined the creation of many other historical locations across various time periods, realistically designed and populated with characters from the past. Large language models (LLMs) could be leveraged to personalize these characters through fine tuning on their writings – or the kind of writings they could have written – from the past, and carefully crafted prompts. This immersive journey into the past holds potential for an exceptional blend of education and entertainment.
Today, we witness the rise of numerous startup companies harnessing the capabilities of LLMs. Companies such as character.ai have focused on crafting personalized characters driven by these models, although they have not yet ventured into recreating historical figures. Some companies in the gaming industry, like Didimo, offer a text-to-3D generator that outputs editable game characters. Initially, my vision centered around incorporating LLMs supported historical characters into a VR space, set in historical locales. In recent times, Augmented Reality (AR) has also emerged as a notable player on the scene. While VR completely replaces our vision with an immersive experience, AR enriches our reality by integrating virtual elements. While VR can offer an unparalleled journey into the past, AR provides the means to bring forth deceased individuals, powered by LLMs, into our present world.
I don’t want to stop here. Imagine this: we could save ourselves as data, so that future generations can play with us even when we are pushing up daisies. And guess what those tech giants with access to our social media might do? Turn us into their very own Ghosts in the Machine and sell our realistic avatars to our grandchildren for massive profit. How spooky, yet amusing!
June 3, 2023
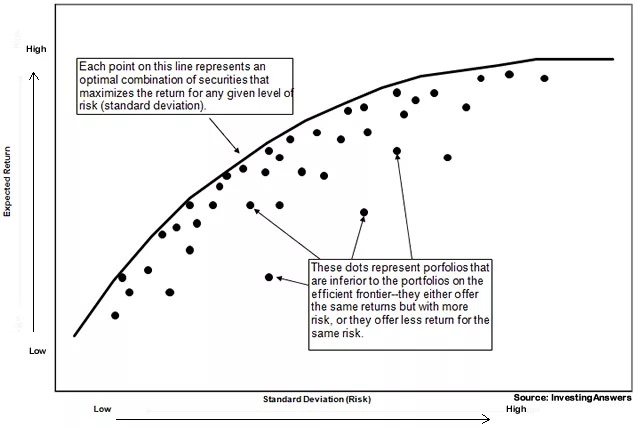
Efficient Frontier
Efficient frontier is a set of optimal portfolios that offer the highest expected return for a given level of risk or lowest risk for a given level of expected return. Portfolio’s expected return is the sum of each product of an individual asset’s expected return with its respective weight in the overall portfolio.
Rp = ∑(Wi * Ri), where Rp = portfolio expected return,
Wi = weight of an individual asset,
Ri = expected return of an individual asset.
Portfolio’s risk is gauged by its standard deviation, which is the square root of variance. Variance is a function of weights, variance and covariance. It is expressed as a dot product of matrices:
σ2 = Wᵀ . V . W, where V = variance-covariance matrix,
W = matrix of individual asset weight,
Wᵀ = transpose of W.
Stock Portfolio
In python, I picked 20 different stocks across different industries to comprise a portfolio using pandas_datareader. Initially, I assigned 5% weight to each stock in order to observe the expected annual return and annual volatility of the portfolio without optimization. Then I calculated returns on each stock. Finally, I used the above formula (Rp) to calculate the annual portfolio return. Backtesting was done on the past five years of stock price data. I calculated the annual variance-covariance matrix with an account that a typical year has 252 trading days. Then I used the above variance formula to calculate the portfolio’s variance, followed by its standard deviation.
The result was an expected annual return of 34.0% and annual risk/volatility of 22.0%. This return and risk composition is suboptimal, and the initial portfolio is one of many suboptimal portfolios that lie below the efficient frontier.
Optimization with Python
I used PyPortfolioOpt to import EfficientFrontier, risk_models, expected_returns, and objective_functions. There is a detailed explanation of this package in its documentation. I calculated the expected return of the portfolio and the annualized sample covariance matrix of individual returns using the imported libraries.
The next step was to optimize the Sharpe ratio. Sharpe ratio is the difference between the returns of the investment and the risk-free return, divided by the standard deviation of the investment. The higher sharpe ratio means that the return/risk relationship is more optimal.
In order to avoid many negligible positions, I set the parameter gamma more than 1 by using objective_functions. Higher gamma diversifies the portfolio. I cleaned the weights to get rid of non essential decimal digits.
Results
I was able to optimize my portfolio with an expected annual return 59.1% for an annual volatility of 28.3%. The sharpe ratio was 2.02, which is a good measure.
Discrete allocation of each stock was calculated by using individual weights of the optimized portfolio and an imaginative $1,000,000 portfolio amount.
Implementation
An investor can implement this strategy to gain higher returns on their investments. They can customize the backtesting period, their portfolio stocks, and portfolio amount and finally get the discrete allocation of stocks in the optimized portfolio. I did the same with my portfolio in an investment challenge, and the result was impressive.
August 22, 2022
A large language model(LLM) is a deep learning model trained on enormous text data available on the internet. LLMs are a remarkable development in the field of Natural Language Processing as they are capable of language understanding and generation. Given a sequence of text, a LLM understands it and predicts the next token in the sequence. It uses an attention mechanism that allows it to highlight the most relevant information of the input text, and that’s how it understands the text. Then the model calculates probabilities of occurrence of different tokens that could follow the input sequence, and generates the token with the highest probability. A token can be a word or a character.
Some of the examples of LLMs are ELMo, Turing-NLG, Generative Pre-trained Transformer (GPT, GPT-2, and GPT-3), BERT, RoBERTa, and so on. These are very large and computationally expensive machine learning models and are developed by corporations and research groups. An individual may not build such a powerful model on their own, however they can fine-tune them on their data to get a desired model. One can fine-tune these pre-trained models on specific data to perform a downstream task, a task that you want to solve. Fine-tuning refers to re-training the pre-trained model on a custom data.
I built a chatbot that imitates Jordan Peterson. First, I created a dataset pretending I was talking to him and his responses are his actual words from either quora answers or interview transcripts. My responses are relevant to his responses and thus it builds up as a conversation. The dataset has in total 761 text messages, which is a small size data.
Next, I fine-tuned DialoGPT on the above dataset. DialoGPT is GPT-2 fine-tuned on conversation data. DialoGPT is an example of fine-tuned LLM to attain a downstream task, to serve as a conversational chatbot. Further fine-tuning on the above dataset makes it chat like Jordan Peterson.
Fine-tuning a pre-trained model works fine to make LLMs perform downstream tasks; however, if the data is large, it faces the same problem of being computationally expensive like training a new model. Recently, researchers have found that prompt learning is very effective in attaining downstream tasks, especially if it requires small data size. Prompt learning is a paradigm of providing LLMs with a carefully designed prompt, for example – descriptions of a task, so it performs that specific task.